Story
As of April 26th, there have been 172 mass shootings in 2023 alone. In just 115 days, there have been 233 people that have lost their lives in a mass shooting. But also in those 115 days, there have been another 13,154 people that have died because of gun violence. Despite the glaring statistics, we rarely hear the story of the 98.3 percent of people that die in individual shootings.
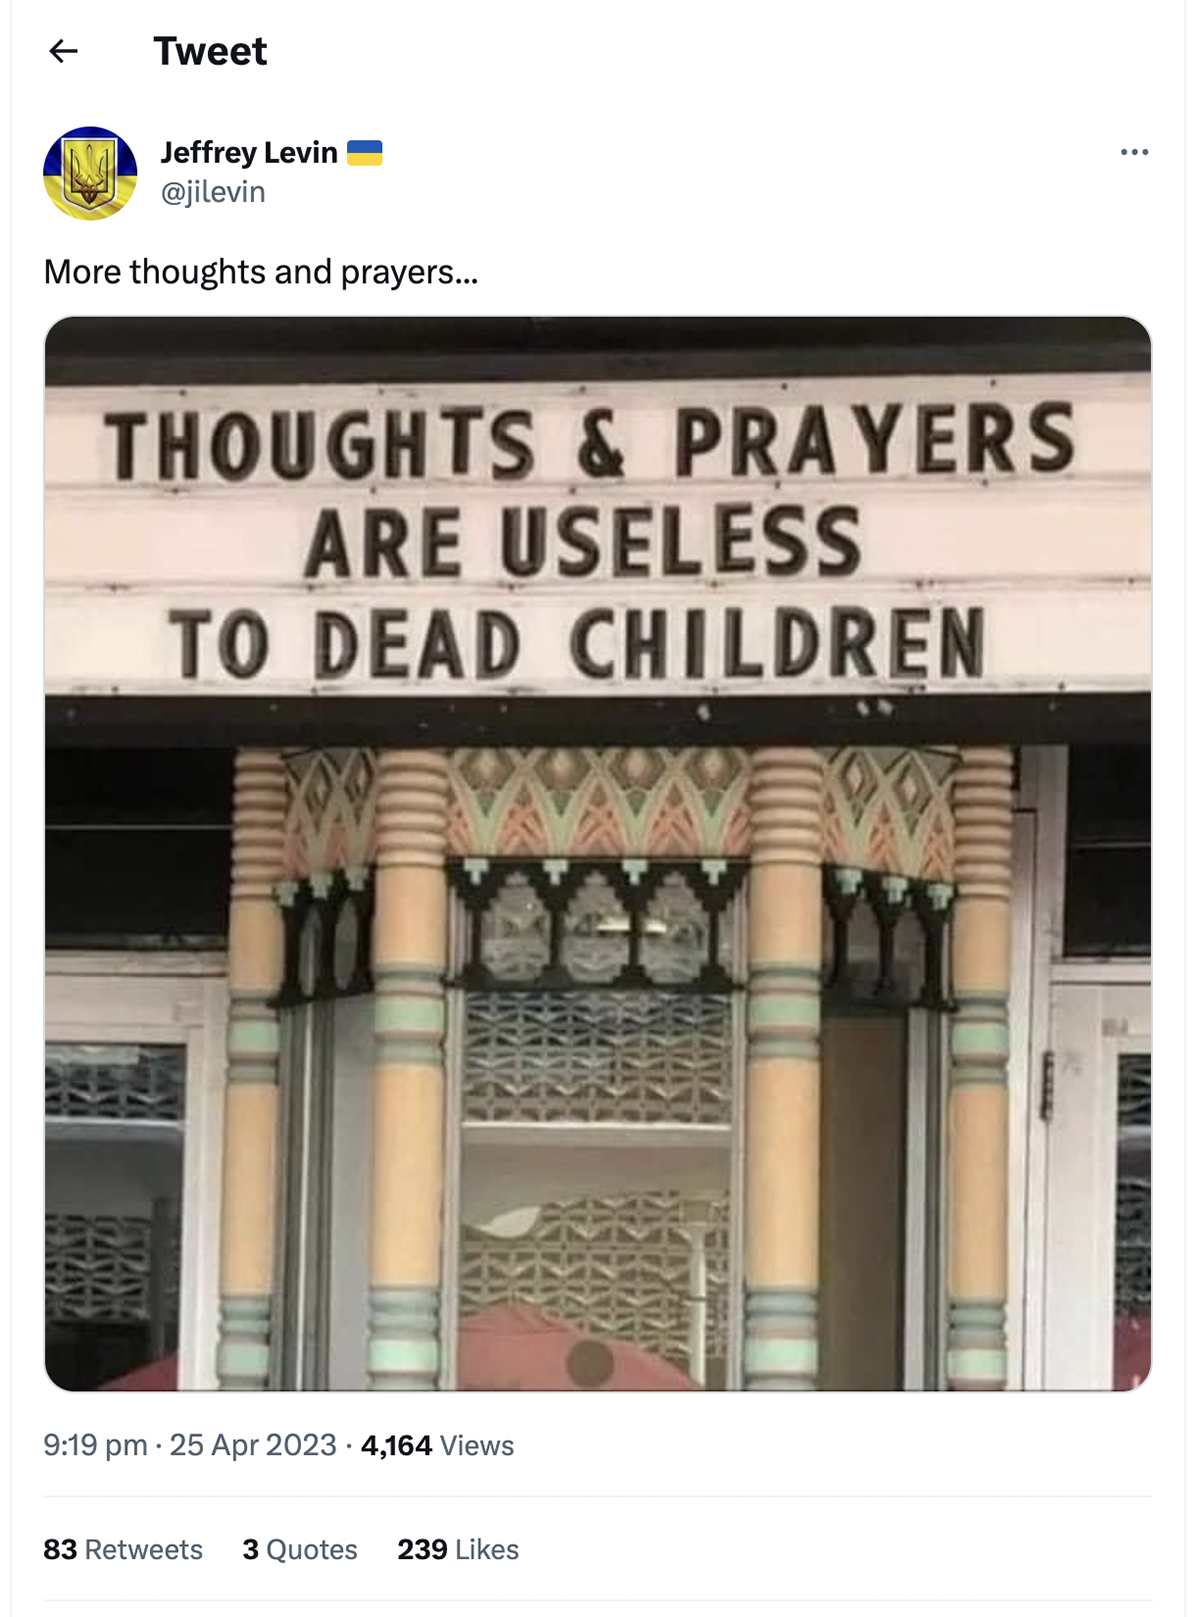
In the aftermath of these mass shootings, the local politicians are often found giving their ‘thoughts and prayers’ and the situation becomes very political. Gun violence in the United States has been classified as a pervasive public health crisis since 2019, but it still is viewed as a political debate.

The sensationalization of gun violence often comes in the form of mass shootings and while they are catastrophic events, they do not represent the full picture of gun violence within the United States. Bad news sells, so the traditional news media will continue to report that mass shootings are the deadliest form of gun violence to the public. This level of sensationalism, especially when it comes to crime reporting leads to a level of increased fear within the communities but it also heightens many other emotions such as grief, shame, rage, and resentment. Below shows the number of lives lost in mass shootings, by state, and by year.
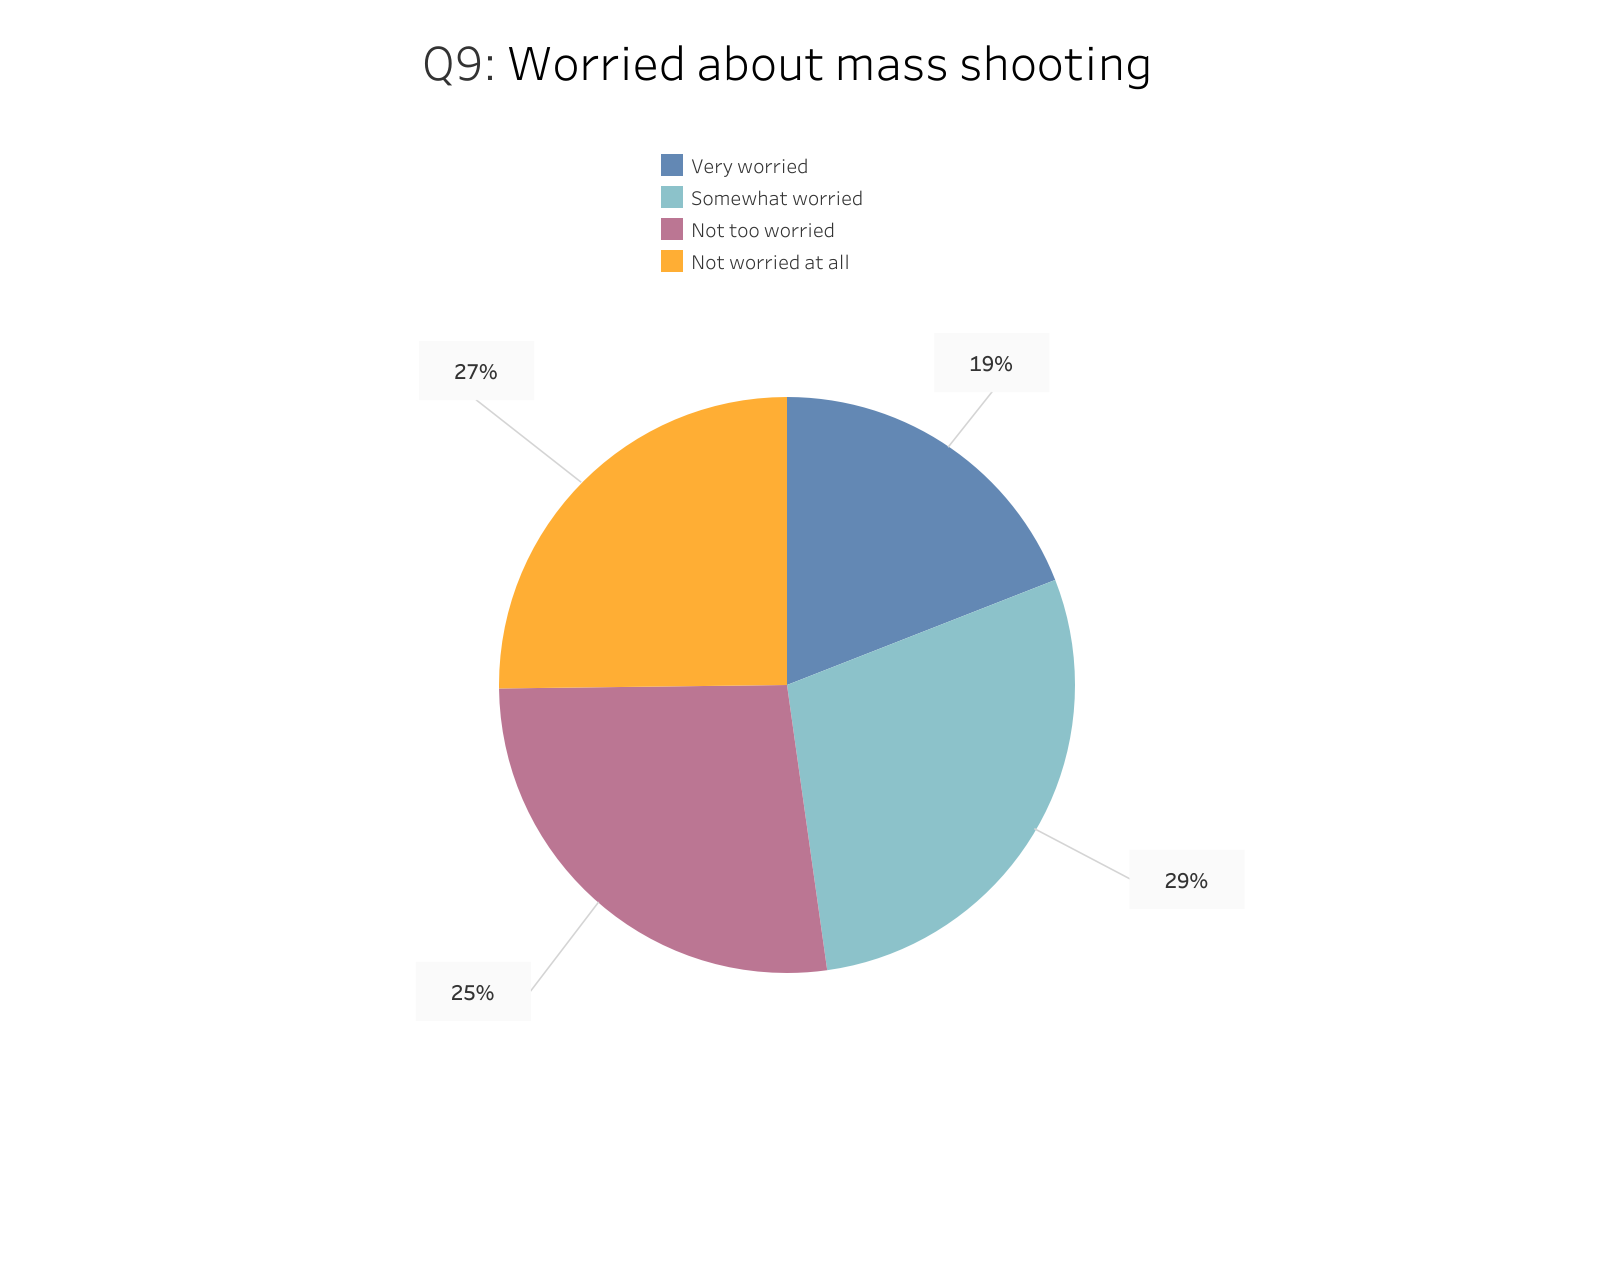
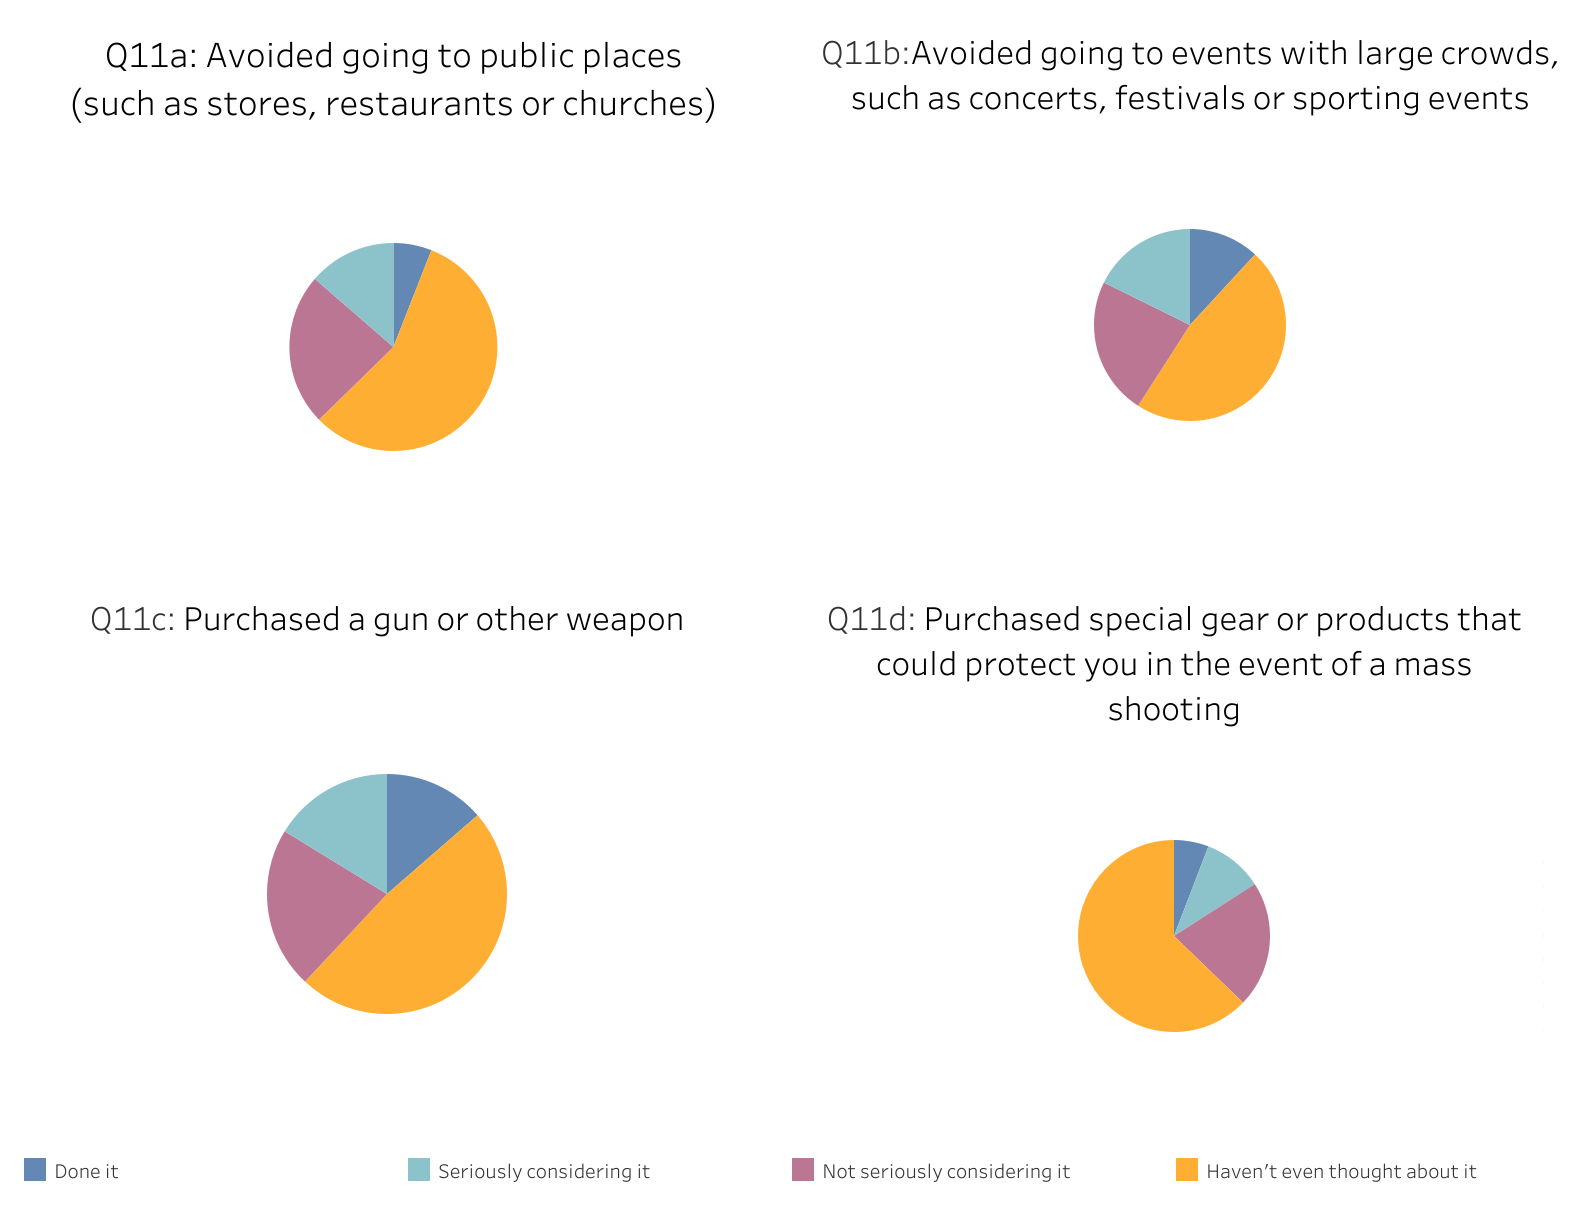
The Gallup News Service conducted a survey in which they asked about the public fears of mass shootings. They found that 48% of the research pool is worried about becoming a victim of a mass shooting (Q9) with 12% avoiding going to events with large crowds, such as concerts, festivals, or sporting events for fear of being involved in a mass shooting (Q11b). This inaccurate representation places a high quantity of the national discourse on a relatively small component of the gun violence epidemic. The news coverage of gun violence deaths is built up as follows: 10% on suicides, 32% on homicides, and 59% on mass homicides which is a startling mismatch from the truth but in reality, for every one death in a mass shooting, there are 56.5 deaths in other incidents of gun violence.
Massachusetts as a state, and Boston as a city both have one of the lowest gun death rates in the U.S. and are often looked to as an example of gun control and prevention. To dismiss the problem in Boston because of stats that are comparatively low is to dismiss the hundreds of individuals, predominantly individuals of color, who are impacted each year by gun violence in this city. The type of attention given to incidents of gun violence perpetuates stereotypes and ignores certain realities. Despite the statistics that indicate nearly 60% of firearm deaths in MA are mostly older White males in western regions of the state, gun homicides in Boston’s Black neighborhoods dominate news cycles. These narratives flatten communities to their most tragic moments. When you initially look at the statistics of shootings in Boston it is easy to read them as they are put in front of you with no additional information, and this is the information that you would get.

When looking at the visualization above it is clear District A1 (Downtown & Beacon Hill) had the most shootings, and District B2 (Roxbury) has the most. When looking at the racing bar chart below, which counts shootings each year in neighborhoods, Roxbury (B2) seems to lead the way.
To see the difference between districts and neighborhoods - click here
When speaking to local community members, they were quick to highlight the inequality of the reporting that happens in their communities. One member said:
“People don't think of Allston-Brighton when it comes to gun violence in Boston. And I think part of that just comes from the number of shootings that happen in Allston- Brighton every year versus other neighborhoods. And so just thinking about how people from the outside look at Allston-Brighton, they think it's a place that's not by gun violence, which is far from the truth. And I remember when I was working at [redacted hospital], just the geographic proximity of Allston-Brighton, Fenway, Jamaica Plain to that hospital in particular, those are mostly the cases that we would see. But yet when there's a dominant narrative around community violence and gun violence specifically, it's associated with Roxbury, Dorchester, Mattapan, Hyde Park”
When asked to expand on this quote, this community member reflected on how they feel like the statistics aren’t always painting the whole picture and how they feel like they are often just reduced to these numbers. They discussed how stories and narratives give ‘qualitative’ that is not always seen.
This conversation in particular sparked an interest, this is just an anecdote but is there data to support it? This is where it was good to have very defined police districts. As you can see by the map on the right, the population isn’t evenly distributed over Boston, C11 or Dorchester has quite clearly the highest population. Once again, anecdotally we knew this, we knew how bustling and alive the community is in these neighborhoods, but to have the data to support it helps to validate the claims.
Then when these two pieces of data were combined, the results were startling. The community members' experiences were backed up by the statistics. Brighton-Allston or District D14 had 95.25 shootings per 1,000 people whereas Roxbury or District B2 was remarkably low, at only 1.81 shootings per 1,000 people.
It is clear to see that something does not add up here. Could it be something to do with the history of colonization, imperialism, racism, and other power imbalances that have been built into our society? From as early as colonization, we have seen the way gun violence has disproportionately impacted Black and Indigenous people. There are many social factors and inequalities that impact gun violence, but as you can see from this map here, these negative narratives are surrounding the communities of color in Boston. Structural racism throughout history, especially through redlining is a huge factor in the way gun violence is still occurring and being perceived today. Historically redlined neighborhoods are predominantly Black and Latinx, and these same neighborhoods are facing gun violence at a disproportionate rate.
These communities are being pushed aside because of their ethnicities and their lived experiences are dismissed because of the blanket of sensationalism and fearmongering media coverage of mass shootings. To acknowledge and honor these communities we must humanize them, and remember that they had a life before this life-changing incident. Louis D. Brown Peace Institute is based in Dorchester and they are creating and sustaining an environment where all families can live in peace and all people are valued. They believe that all families impacted by murder deserve to be treated with dignity and compassion, regardless of the circumstances. Maybe these are the stories we should be sharing, re-telling, and uplifting. Maybe this will give the city of Boston a more accurate representation of these communities that are doing so much work toward peace.
Transforming Narratives of Gun Violence is an initiative housed at the Engagement Lab at Emerson College, formed in partnership with MGH Center for Gun Violence Prevention, and the Louis D. Brown Peace Institute. This collaborative initiative is aiming to interrupt dominant narratives of gun violence and restore urgency, dignity, and humanity to this pervasive issue. They are working to highlight the journeys of overcoming grief, the mutual aid extending between families, and the countless organizations and groups working tirelessly to interrupt cycles of violence and create conditions for peace. They are designing platforms so these communities can tell their own stories and hear each other's to help in the healing process and give light to these stories for the wider public to consume.
Methodology
When starting this story, I had a brief idea where I wanted to go with it but as it always goes, the more research I did, the more of a rabbit hole I fell down.
I initially started on the Gun Violence Archive to get the most up-to-date and non-partisan statistics. They provide a running counter which analyzes data from multiple sources to validate it, this organization does not partake in the debate on gun rights vs gun regulations but purely just understands crime at a street level, providing crime statistics broken down.
This led to my first infographic which came from a basic calculation of all gun violence-related deaths minus mass shooting deaths to find out how many lives are lost outside of these tragic events. This number was then divided by the mass shooting deaths to get the final statistic of “For everyone life lost in a mass shooting, 56.5 people die from other incidents of gun violence”.
This led to my first infographic which came from a basic calculation of all gun violence-related deaths minus mass shooting deaths to find out how many lives are lost outside of these tragic events. This number was then divided by the mass shooting deaths to get the final statistic of “For everyone life lost in a mass shooting, 56.5 people die from other incidents of gun violence”.
My next step was to show how many people die in mass shootings, to hopefully drive home how many people die outside of these events. I downloaded The Violence Project Mass Shooter Database. Once again, The Violence Project is a “nonprofit, nonpartisan research center dedicated to public criminology and data-driven violence prevention” which is important for the authenticity of their data. This database is extremely thorough and detailed so it was important for me to clean the data to purely what I needed.
Once I cleaned the data, I set it up states along the Y-Axis and years along the X-Axis. Then the other fields were filled by how many people were killed in a mass shooting each year. Once this data was cleaned I then put it into Flourish to get the racing bar chart with the timeline element.
The next set of data I used was the survey conducted by The Gallup News Service surrounding the worry Americans feel surrounding mass shootings. I think this piece was especially effective to show the sensationalism that happens in the media, leaving average Americans to believe that mass shootings are the deadliest form of gun violence. This data was saved as a PDF, so it had to be exported as an Excel spreadsheet before I could even begin to clean it. I decided to use minimal variables to get as clear-cut an answer as necessary. I did take all four questions from this survey as I believed they all effectively showed different consequences for this type of fearmongering media.
The dataset, collected by Boston Police Department, is updated on a weekly basis and describes shooting incidents where a victim was struck by a bullet, either fatally or non-fatally. This dataset does not take into account if the shootings were justifiable or not which helps validate the data, by only showing the basic data. This data set does define where the shootings happen in terms of police districts, so I did need to find a way to combine these. I downloaded the GeoJSON file from Boston Open Data which gave the neighborhood names and the physical boundaries, so I used the Boston.gov site to match police districts to neighborhoods. I then put this data into Flourish to create the racing bar charts. I chose to display this chart by neighborhood as this is what is most well-known.
The next steps included adding all the data onto one Tableau Workbook and adding the populations of each neighborhood to connect them all. I brought in the populations of each neighborhood to normalize the shooting data. This was the calculated field formula to get the shootings per 1,000 people in each neighborhood.
I then had to continue building the story around these visualizations, as I continued with some more data to bulk it out, I continued on the narrative element of the story. Through my external work on this topic, I knew a lot about the systemic racism and injustices that affect these communities so it was important for me to ensure this came across and it did not just feel like another piece written about shootings in the United States. I also know a lot about the healing work that is being done in these communities so it was important for me to ensure that these organizations are getting the recognition they deserve. This greater initiative is about transforming the narrative of gun violence within Boston and I wanted to ensure this project would help advance the goals of this initiative.
Data download links

